A visual story
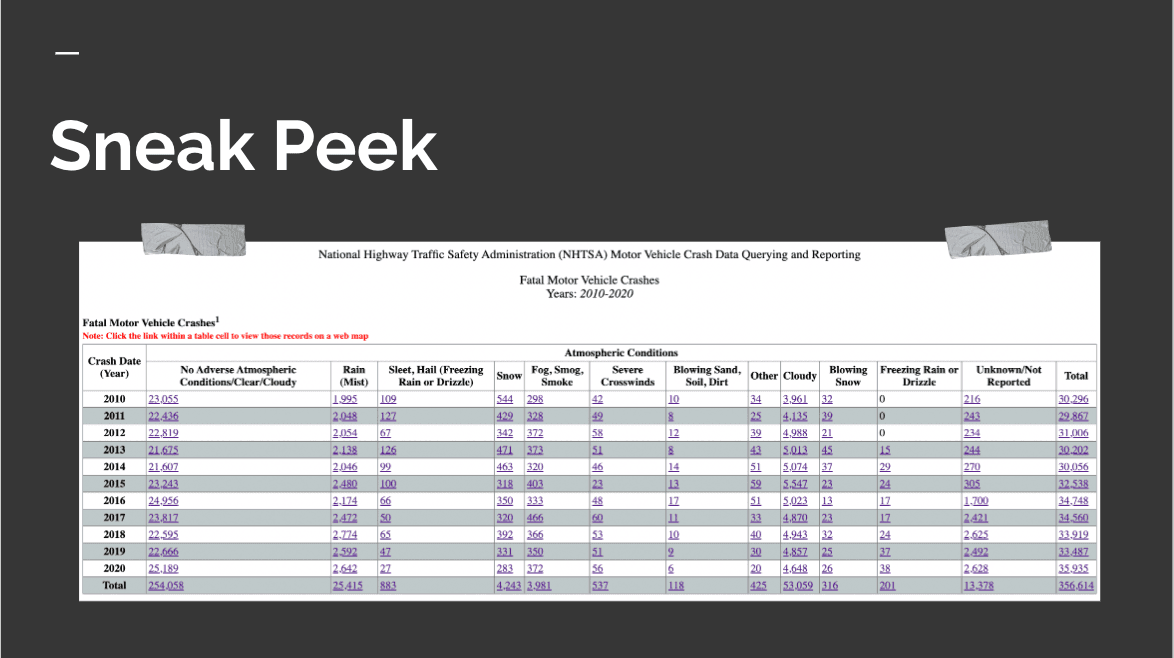
This data was in the oldest excel format possible…
2023
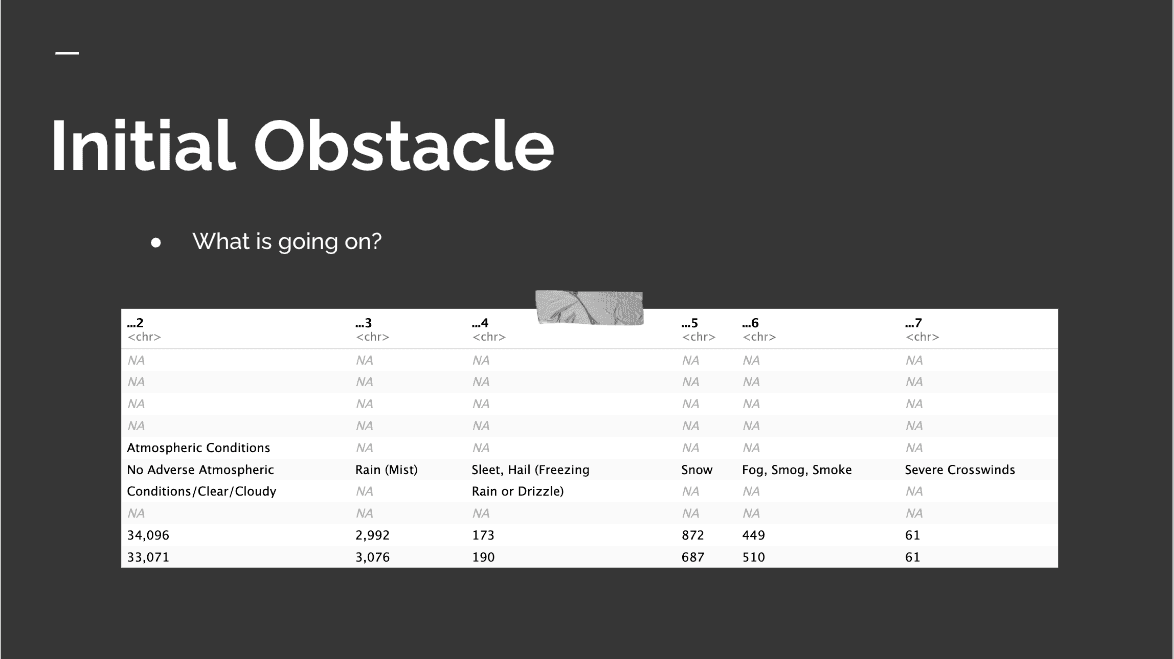
Importing the datasets was a mission. 🚀
2023

A function to wrangle regular expressions solved it!
2023
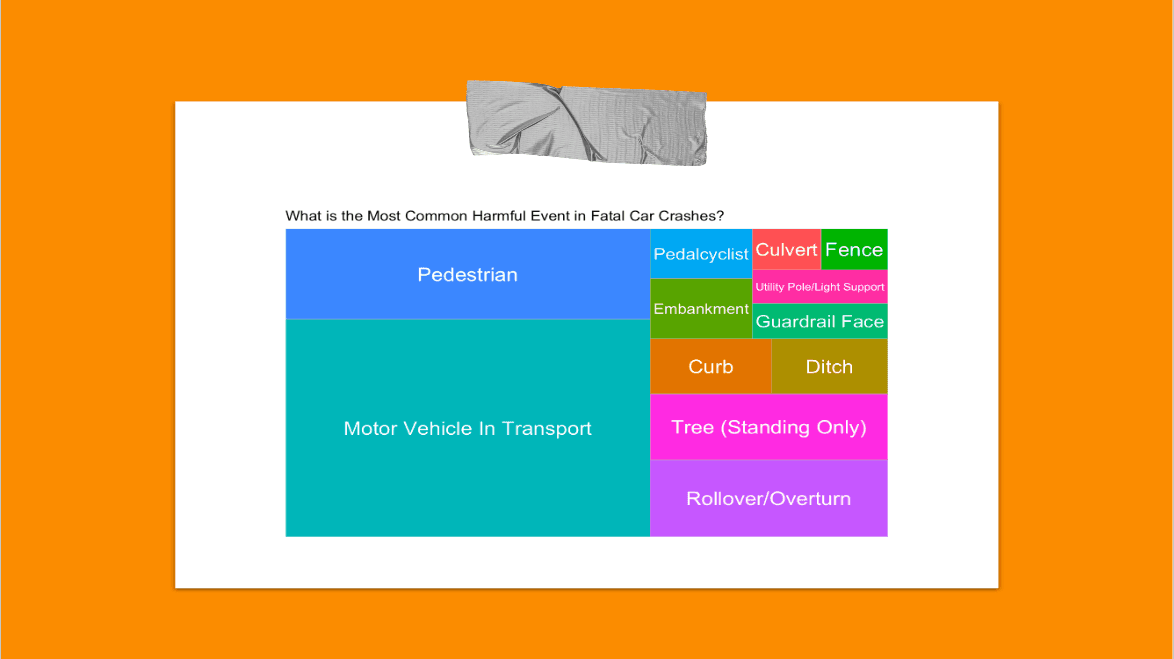
Treemaps! 🌲
2023

Word cloud shows us the vehicle manufactures with the most crashes 🚗
2023
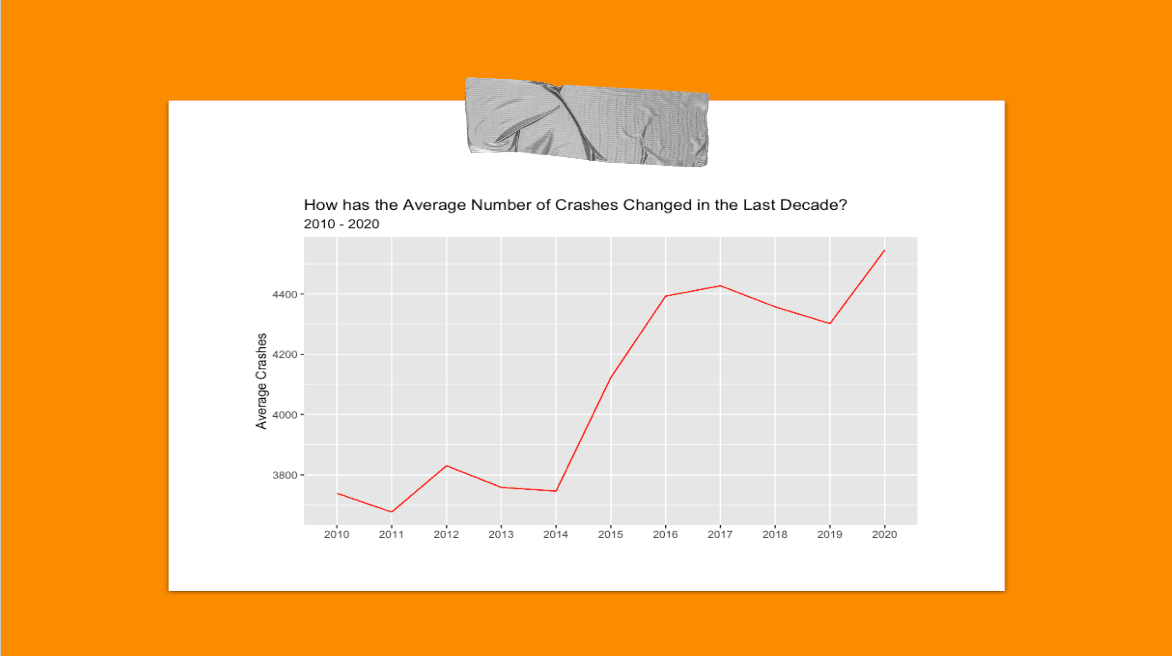
A decade worth of trends 📈
2023
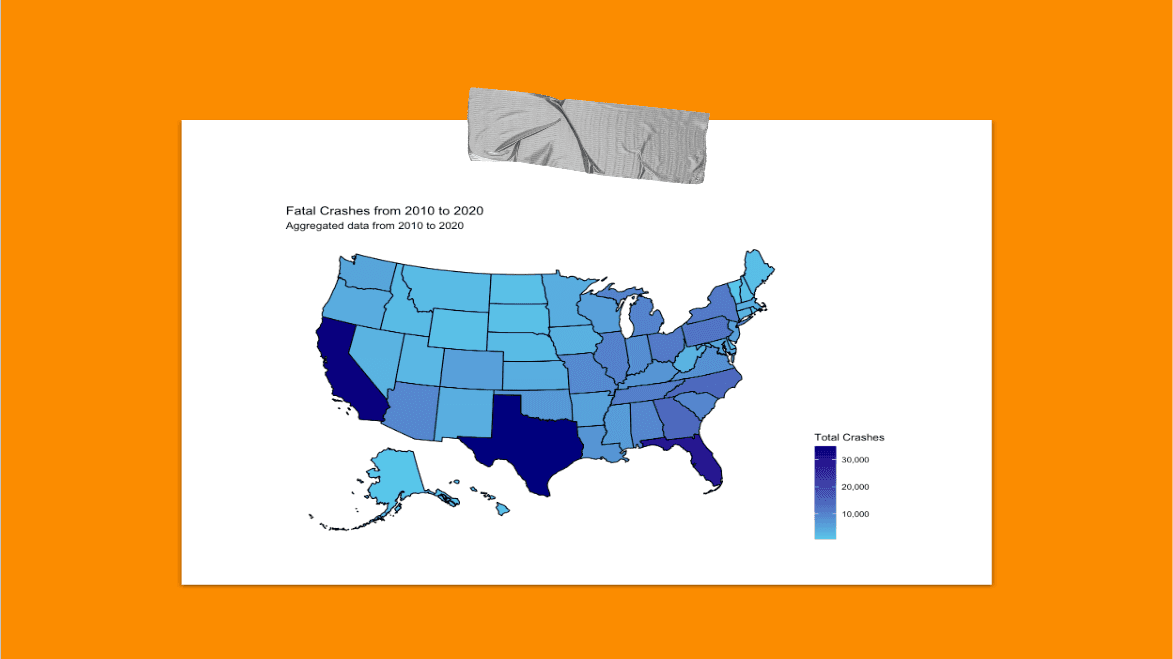
How does this analysis look at the National level? 🇺🇸
2023

"Alexa", why is there an error in the Miami-Dade County?
2023

What are your thoughts?
2023
About
Every year, NHTSA comes out with a summary fatal car crashes in the United States. My interest with this project was to analyze the data from 2010 to 2020 to determine if a better understanding of the factors that contribute to these accidents can be learned. The data was acquired from NHTSA’s powerful online query and my analysis was focused on data cleaning, data wrangling and data visualizations.
Code